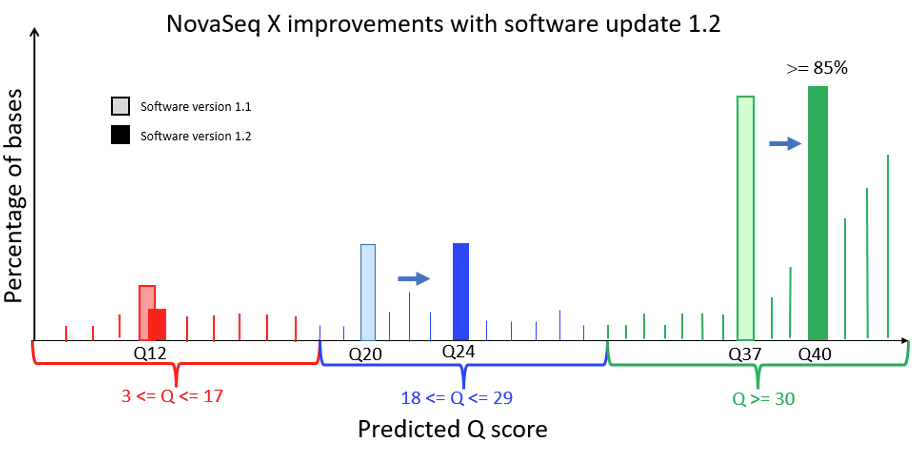
The first shipments of the NovaSeq X Series introduced XLEAP-SBS chemistry on Illumina’s next-generation high-throughput platform. By enabling the 25B flow cell, the NovaSeq X software update 1.2 now produces up to 16 terabases in a dual flow cell sequencing run. With this update, the NovaSeq X Plus can generate tens of thousands of whole genomes per year. Along with higher throughput, the 1.2 release has an upgraded workflow for better accuracy and improved Q-score calibration. Through the combination of improved Q-score accuracy and XLEAP-SBS chemistry, the NovaSeq X’s medium- and high-base-quality bins shift from Q20 to Q24, and from Q37 to Q40, respectively. The instrument’s higher and more accurate base qualities better reflect the capabilities of XLEAP-SBS chemistry and the NovaSeq X Series platform.
Control software version 1.7 on the NextSeq 1000 and NextSeq 2000 Sequencing Systems, paired with XLEAP-SBS chemistry (coming in the first half of 2024), also has the same upgraded workflow for better accuracy and improved Q-score calibration.
In this article, we highlight:
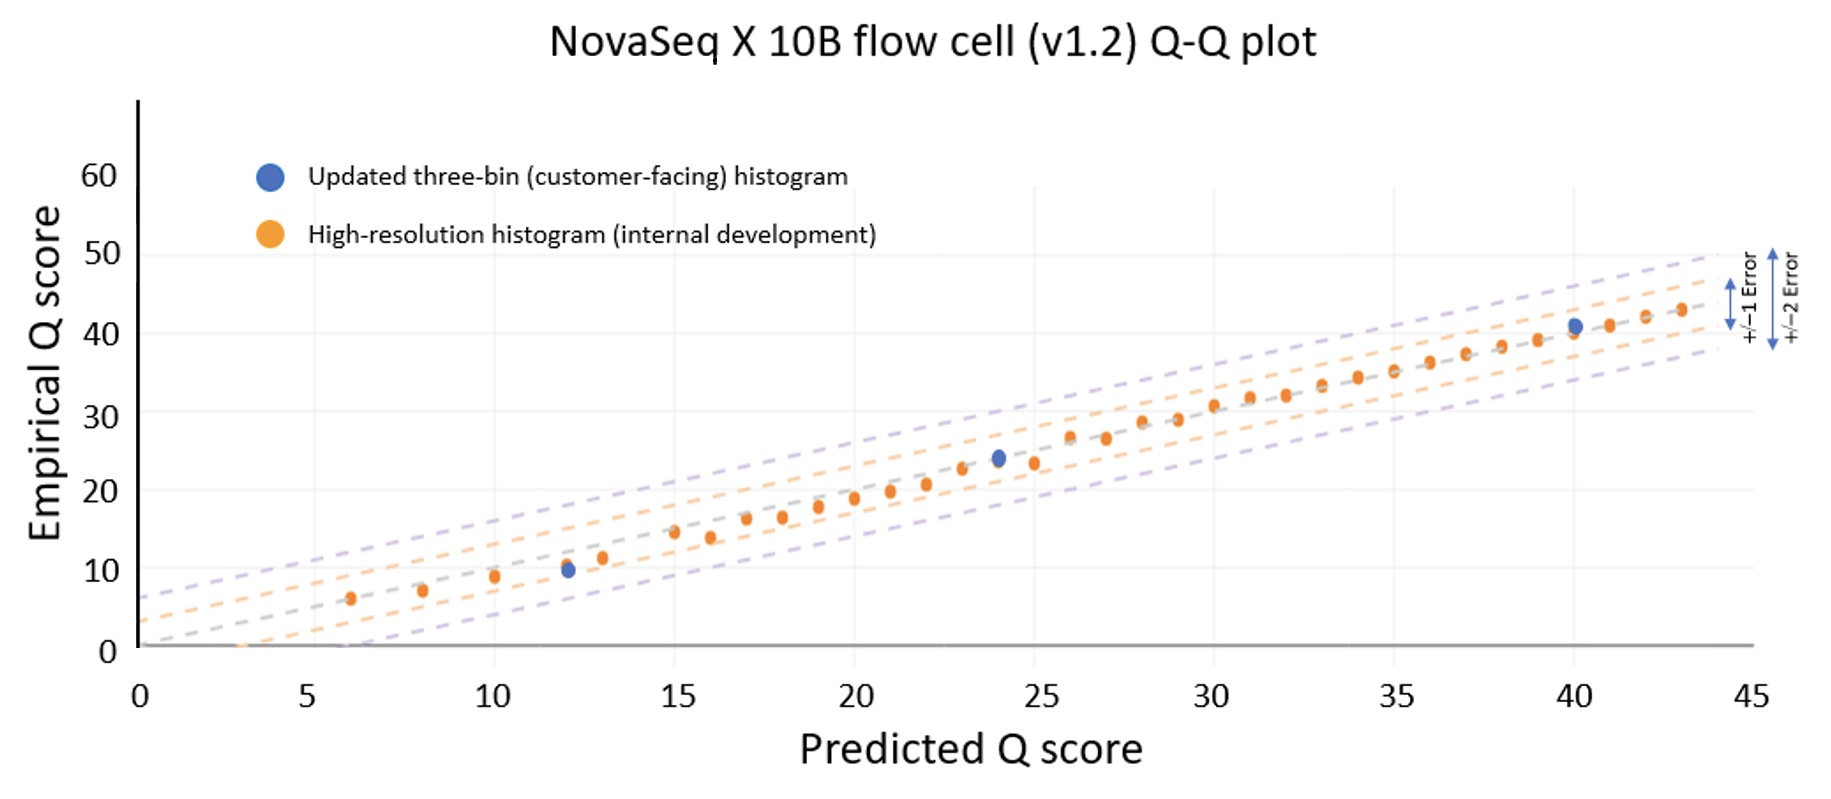
- The improvements to sequencing and calibration workflows that enable the NovaSeq X to deliver 85% of bases in the highest quality bin (Q40) with excellent correlation to empirical accuracy
- The use of PCR-free library preps in the Q-score calibration process—so that the Q scores more closely represent the quality of sequencing and not that of sample preparation
- The data management and cost benefits of quantizing the Q scores to three bins
- The impact of Q-score quantization on downstream applications
- The application of the sequencing and calibration workflows to the NextSeq 1000 and NextSeq 2000 Systems
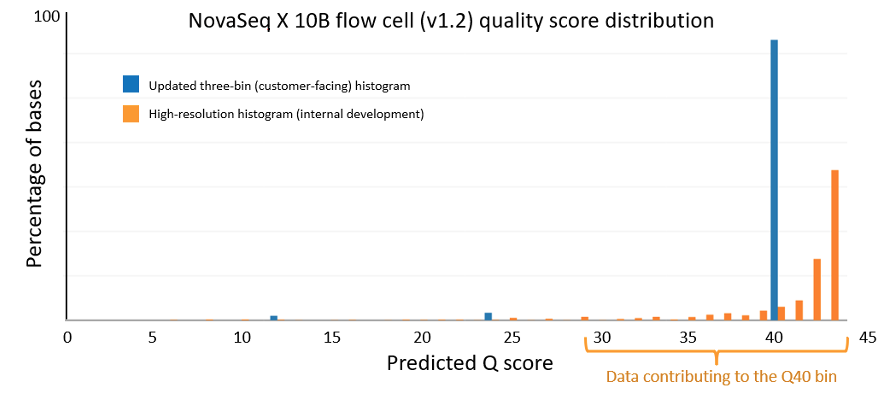
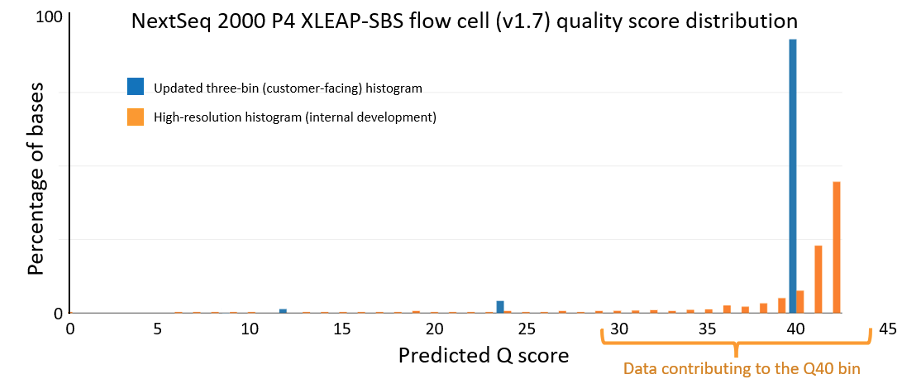
Figure 1 below is a Q-score histogram illustrating the improvements in the NovaSeq X 1.2 update. This diagram is also applicable to the NextSeq version 1.5 to version 1.7 control software update. A thin line in the diagram represents the percentage of bases with a quality score at a specific integer value. To reduce customer costs and data transfer times, the sequencer aggregates these integer-spaced quality scores into three bins, shown as darker bars, with labels Q12, Q24, and Q40. These bins contain, respectively, base qualities in the range from 3 to 17, from 18 to 29, and from 30 and above. The label below each of the darker bars represents the quality score of all bases in that aggregated bin. Since the label is the average quality of the binned data, the bin will naturally aggregate bases with individual high-resolution quality scores both above and below the labeled value. Since Q score is a log scale (see details below), the distribution is asymmetric, with aggregated bins mostly composed of higher quality bases. The 1.2 update results in a more accurate representation and a shift upward in quality scores, with the highest-quality bases now reported as Q40. The NovaSeq X is capable of producing >= 85% of output bases with a Q40 score; the majority of these bases exceed Q40 at high resolution.
Control software version 1.7 enables updated Q scores on the NextSeq 1000 and NextSeq 2000 Systems
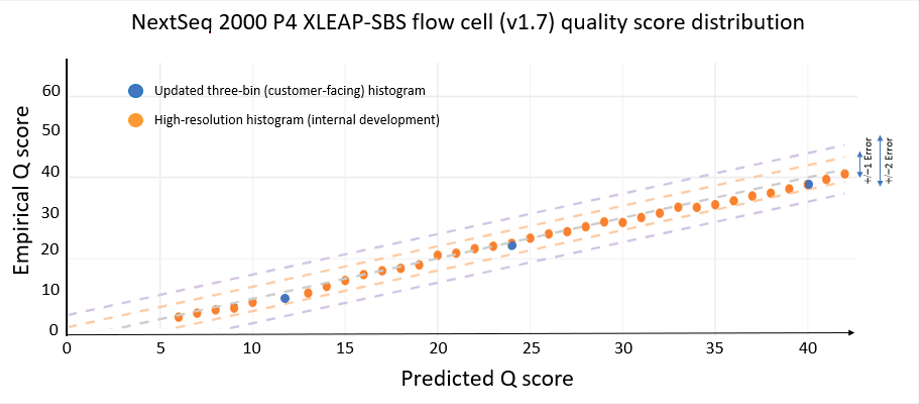
The data quality improvements introduced with XLEAP-SBS chemistry and improved calibration also translate well to Illumina’s flagship benchtop platforms, the NextSeq 1000 and NextSeq 2000. On the NextSeq 2000, a PCR-free library prepared from an HG001 sample yields the data quality shown in Figure 5 below. The results were demonstrated using the P4 XLEAP-SBS flow cell, with the P3 XLEAP-SBS flow cells showing comparable performance. Once again, the average Q score in the highest-quality bin achieves an empirical error rate of Q40 (1 error in 10,000), up from Q34. Bases in the Q40 bin represent more than 90% of output bases of the run. Considering the high-resolution histogram, the majority of these bases actually equal or exceed Q40.
Q-score basics: What are base quality scores? What are Phred scores?
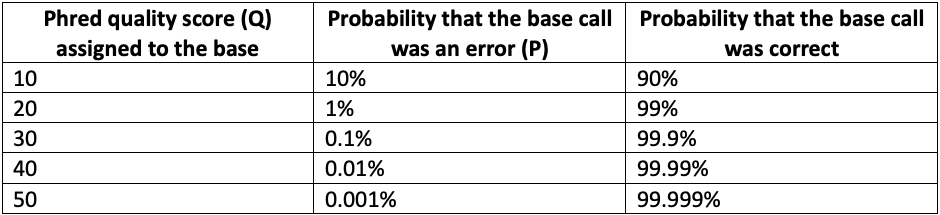
As each base is decoded on an Illumina sequencer, the base-calling model assigns a confidence score representing the probability that the assigned base call is correct.1 The raw probability of base call error is converted to a logarithmic scale to compress dynamic range, much like the dB nomenclature used for power measurements. The resulting scaled value is known as a base quality score (or as a Q-score, or Phred score). For example, when the base caller is 99% confident that a base call is correct, there is a 1% probability of an error, which translates to a Phred (Q) score of 20.
Mathematically, Phred quality scores are defined as Q = -10 log10 P, where P is the probability of base calling error. As the Phred score increases, the confidence in the base call increases in a nonlinear fashion, as shown in Table 1 below.
Q-score sources of error: Not all errors are generated on the sequencer
A properly calibrated Q-score model predicts the probability of sequencing error. However, it is important to understand that while some errors are due to the sequencing process itself—for example, due to noise or low signal power—others originate upstream from the sequencer. Common sources of error in NGS workflows are shown in Figure 7 below.
Before sequencing, sample extraction and library preparation convert a genomic DNA sample into a library of fragments. This process typically involves fragmentation, the addition of specialized adapters to both ends of each fragment, and often amplification or purification steps. Several published papers describe errors that can be introduced by these processes.2-4 The sequencer cannot distinguish bases with errors introduced by sample preparation from other bases in the sample; sample-preparation errors are introduced silently upstream. Therefore, the estimation and mitigation of sample-preparation errors must be performed in the downstream pipeline through error-correction algorithms.
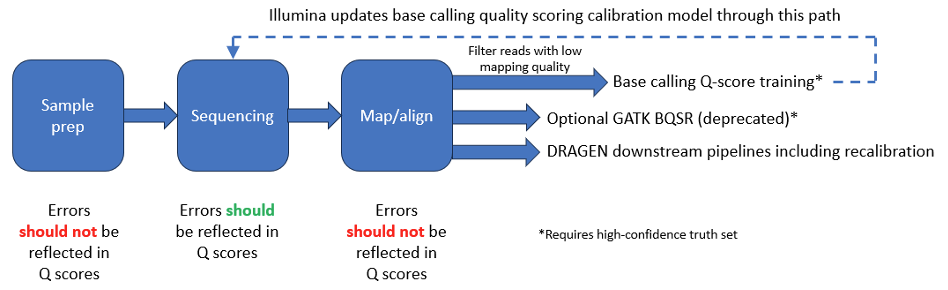
The method used for quality-score calibration training naturally includes errors from both sample preparation and the sequencing process itself (see appendix). Calibration that uses only PCR-free data produces quality scores that more closely reflect the actual sequencer base-calling accuracy, since PCR-free library preparation minimizes sample preparation errors.
Recalibration processes in downstream analysis can characterize sequencing and sample preparation errors dynamically on new datasets, improving accuracy for highly sensitive applications. Further, these calibration processes can be customized for specific end-user pipelines, compensating for sample prep error signature variation. The Broad Institute’s Genome Analysis Toolkit (GATK) best practices include a base quality score recalibration (BQSR) step that estimates a mapping between assigned base quality and empirical base quality.5 A difficulty with BQSR is that it requires a database of known variant sites, which for most samples is not readily available.
DRAGEN pipelines include sophisticated algorithms6 that estimate error mechanisms on a per-pipeline/sample basis, without requiring access to truth sets, and with particular emphasis on PCR-related artifacts; DRAGEN neither requires nor uses BQSR.
Q-score resolution: A deluge of genomic data drives optimizations in base quality labeling to reduce storage needs
As the data throughput from Illumina’s sequencers increased massively over time, Illumina adopted a quantized quality score to reduce data transfer times and storage costs for customers.
Early Illumina instruments, such as the MiSeq System, generated Q scores using 50 whole-number bins. To significantly decrease the storage footprint of the sequencer output data, newer systems represent the Q-score continuous space with fewer bins; this approach reduces the entropy of the quality scores, allowing higher levels of compression. The NovaSeq 6000, NextSeq 1000, NextSeq 2000, and iSeq all use a three-bin Q-score table. Figure 8 shows the benefit of aggregating quality scores into a reduced number of bins. The storage size of FASTQ files (in gzip format) and BAM files is reduced by as much as 50%, which translates directly to a savings in storage costs.
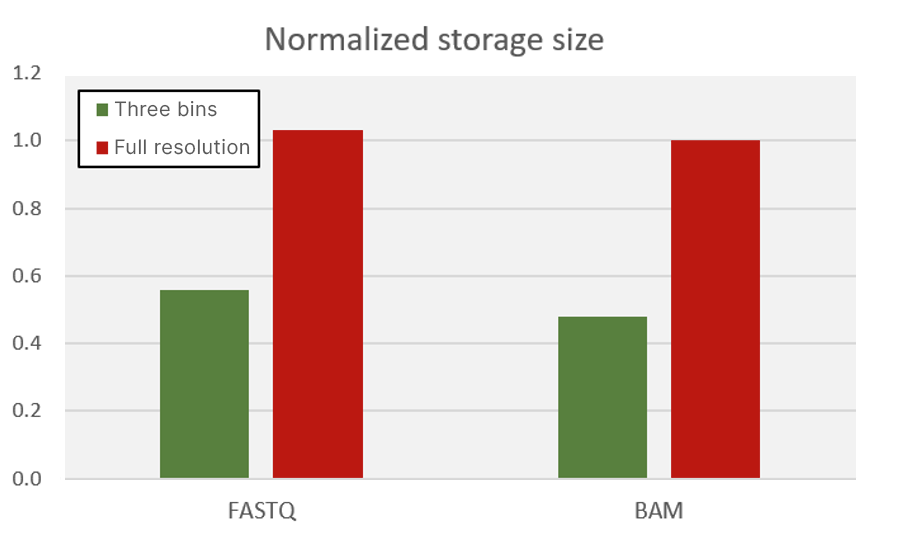
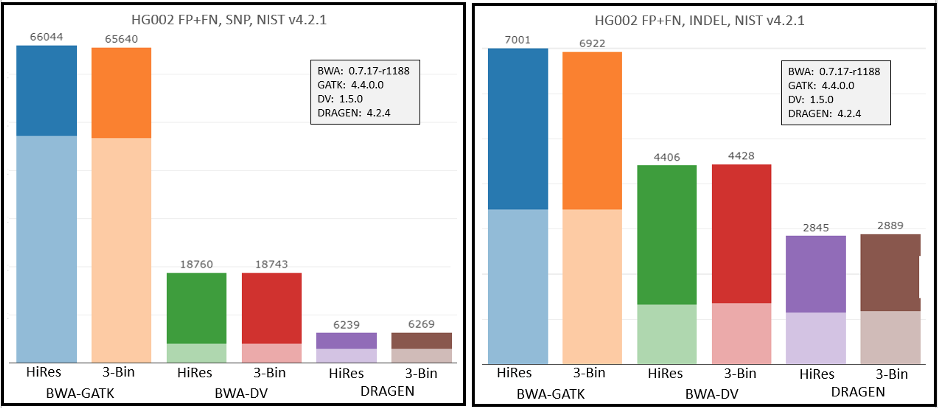
lllumina and its customers have demonstrated that the decrease in Q-score resolution has little or no impact on downstream pipelines and saves significant amounts of data transfer time (very important for large sequencing projects and production-scale sequencing) while also significantly reducing the required data storage (very important for controlling customer costs). More information can be found in an Illumina app note on this topic.7
Q-score significance in downstream applications: Do Q scores matter?
Quality scores beyond Q35 have very little effect in germline applications using state-of-the-art variant callers. Accuracy is largely limited by coverage, not by base quality scores. Coverage requirements are dominated by Poisson sampling—see for example this paper from the Journal of Computational Biology.8 As higher-sensitivity somatic applications (including minimal residual disease) are developed—where variants can have much lower allele frequencies—higher Q scores can reduce the amount of raw sequencing data required. The DRAGEN somatic pipeline includes algorithms to improve detection of errors introduced during sample preparation.9
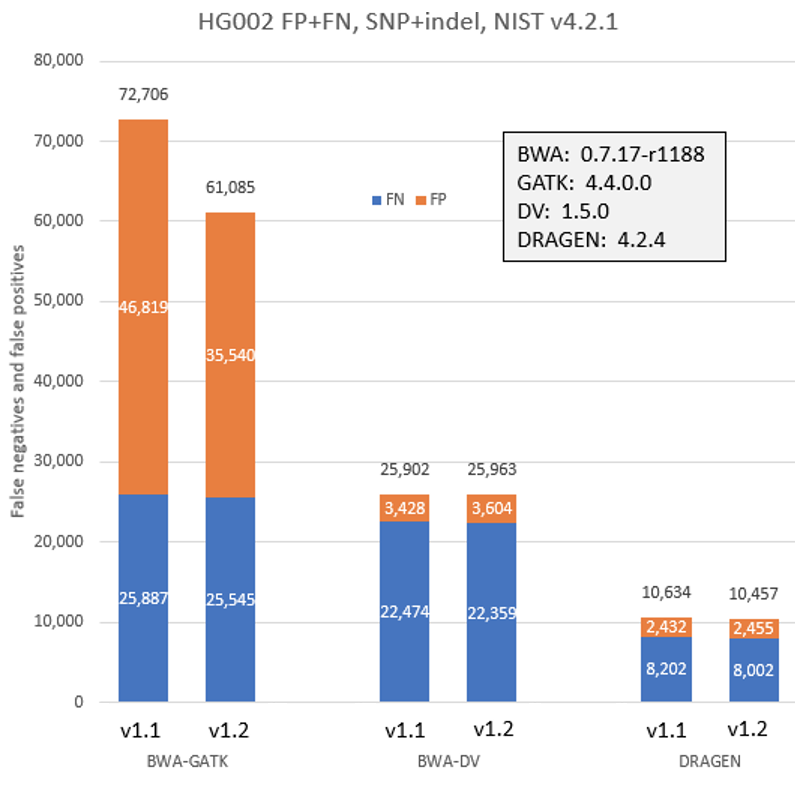
To check the impact of the new workflows and Q-score prediction improvements from the 1.2 update on secondary analysis, we analyzed the HG002 genome sample with three popular analysis pipelines on versions 1.1 and 1.2. As shown in Figure 9 below, GATK’s accuracy results improved with the improved Q scores. DRAGEN and DeepVariant performance showed no significant change with the improved Q scores.
Conclusion
The release of the NovaSeq X software 1.2 and the NextSeq 1000 and NextSeq 2000 control software version 1.7 updates more accurately reflect the sequencing quality of the XLEAP-SBS chemistry. With more accurate base calling, quality scoring, and binning, the NovaSeq X, NextSeq 1000, and NextSeq 2000 Sequencing Systems now deliver bases in the highest quality (Q40) bin.
Further, the 1.2 version of the NovaSeq X software and the 1.7 version of the NextSeq 1000 and 2000 control software incorporate the following important considerations when assigning a quality score:
- Base-quality scores capture statistical sequencer error rate and are estimated on-sequencer without a ground truth
- To minimize errors introduced in the sample preparation process, PCR-free library-preparation methods are used in Illumina’s calibration process
- Efficient Q-score binning is important to reduce customer costs and data transfer times
- Binning has little or no impact on germline applications with state-of-the-art variant callers
For additional information about NovaSeq X software 1.2 update, click here.
Appendix: Q-score calibration training
Before a customer release, sequencer platforms optimize base quality score prediction using calibration training. This ensures that base quality scores assigned on the sequencing platform closely match empirical base calling accuracies.
Many base quality score calibration training algorithms are derived from a foundational paper published in 1998 that describes a computationally efficient way to assign quality scores.10 It uses a small number of predictor variables, such as signal-to-noise ratio, to build a lookup table. Each row records empirical quality in a small region of the predictor space. It provides an easy way to generate base quality scores given a set of quantized predictor values. Though the paper uses four heuristic predictors derived from chromatogram files, the general approach can be applied using any number of predictors in any type of sequencing system.
Empirical quality is defined as the number of bases that were called correctly as a ratio of total number of bases that were called, for the given region of predictor space. The bases used for this calculation are restricted to bases where truth is known, for example, Genome in a Bottle (GIAB) truth sets for human data, which covers a large proportion of the human genome. Other genomes (bacteria, microorganisms) with their own high-quality truth sets are included, to ensure that k-mers are as fairly represented in training as possible. Areas prone to mapping errors are removed from the calculation, since mapping is not part of the sequencing operation and should not contribute to sequencing error rate measurements.
Version history:
January 11, 2024: The title of this article has been updated from "NovaSeq X v1.2 software enables sequencing with 80% of bases >= Q40."
December 21, 2023: This article has been updated with information about control software versions 1.5 and 1.7 for the NextSeq 1000 System and NextSeq 2000 System.
References:
- Illumina. Understanding Illumina Quality Scores. illumina.com/content/dam/illumina-marketing/documents/products/technotes/technote_understanding_quality_scores.pdf. Published 2014. Accessed October 9, 2023.
- Chen G, Mosier S, Gocke C, Lin M-T, Eshleman J. Cytosine Deamination is a Major Cause of Baseline Noise in Next-Generation Sequencing. Mol Diagn Ther. 2014 Oct; 18(5): 587–593. doi:10.1007/s40291-014-0115-2
- Otsubo Y, Matsumura S, Ikeda N, Yamane M. Single-strand specific nuclease enhances accuracy of error-corrected sequencing and improves rare mutation-detection sensitivity. Arch Toxicol. 96, 377–386 (2022). doi:10.1007/s00204-021-03185-y
- Gregory T, Ngankeu A, Orwick S, et al. Characterization and mitigation of fragmentation enxyme-induced dual stranded artifacts. NAR Genom Bioinform. 2020 Dec; 2(4). doi: 10.1093/nargab/lqaa070
- Caetano-Anolles D. Base Quality Score Recalibration (BQSR) – GATK. Broad Institute Genome Analysis Toolkit. gatk.broadinstitute.org/hc/en-us/articles/360035890531-Base-Quality-Score-Recalibration-BQSR-. Published 2023. Accessed October 9, 2023.
- https://science-docs.illumina.com/documents/Informatics/dragen-v3-accuracy-appnote-html-970-2019-006/Content/Source/Informatics/Dragen/dragen-v3-accuracy-appnote-970-2019-006/dragen-v3-accuracy-appnote-970-2019-006.html
- Illumina. NovaSeq™ 6000 System Quality Scores and RTA3 Software. illumina.com/content/dam/illumina-marketing/documents/products/appnotes/novaseq-hiseq-q30-app-note-770-2017-010.pdf. Published 2017. Accessed October 9, 2023.
- Deng C, Daley T, Calabrese P, Ren J, Smith A. Predicting the Number of Bases to Attain Sufficient Coverage in High-Throughput Sequencing Experiments. J Comput Biol. 2020 Jul; 27(7): 1130–1143. doi: 10.1089/cmb.2019.0264
- Scheffler K, Catreux S, O’Connell T, et al. Somatic small-variant calling methods in Illumina DRAGEN™ Secondary Analysis. bioRXiv 2023.03.23.534011. doi:10.1101/2023.03.23.534011
- Ewing B, Hillier L, Wendl M, Green P. Base-Calling of Automated Sequencer Traces Using Phred. I. Accuracy Assessment. Genome Res. 1998;8:175–187. doi:10.1101/gr.8.3.175