Key takeaways about DRAGEN STR
- The DRAGEN DNA pipeline includes a short tandem repeat caller
- When paired with PCR-free whole-genome sequencing, this caller has > 98% sensitivity for medically relevant repeat expansions in genes like FMR1, ATXN1, HTT, and C29orf72
- False positives are rare (< 1%), but confirmatory studies are recommended to confirm and more accurately size putative positives
What are STR and why do they matter?
Short tandem repeats (STR) are regions of the genome where simple sequences of DNA are copied back to back (Table 1). There are many STR regions in the human genome, most of which have no known function.
| Person A: (CAT)×3: ...CATCATCAT... |
| Person B: (CAT)×1: ...CAT... |
| Person C: (CAT)×9: ...CATCATCATCATCATCATCATCATCAT... |
Table 1. A hypothetical example of an STR

Figure excerpted from the gnomAD v3 database, PMID 32461654.1
The first discovery of an association between STR variability and a medical condition was Huntington disease. To learn more about Marcy MacDonald, PhD, and the history of her team's groundbreaking discovery, check out this article from Nature Education. Individuals with Huntington disease have greater than 40 consecutive sets of three nucleotides ("trinucleotide repeat") C-A-G within a gene named after the condition (HTT). This sequence is within the coding sequence of the gene, which is translated into repeats of the amino acid glutamine. The increased number of consecutive glutamines in the resulting protein causes aggregation in neurons, which eventually leads to the clinical signs and symptoms of Huntington disease, including ataxia and neurological decline.
In families with Huntington disease, which has an autosomal dominant inheritance pattern, it was noted that children of affected individuals often had earlier onset of symptoms and a more rapid course of neurodegeneration. STR analysis showed that the expanded repeats were expanding even further in the severely affected offspring, providing a mechanism for this tragic phenomenon, now called "anticipation."
One of the most insidious aspects of Huntington disease is that symptoms typically do not appear until after a person has already had children, and those children are at a 50% risk of inheriting an expanded STR. With the tools now available, it is technically possible to screen everyone for this disease much earlier. Unfortunately, there are no effective treatments yet, so it is not appropriate to recommend this kind of testing to the general population. Efforts are underway to pursue targeted gene therapy for Huntington disease. If a gene-based cure for Huntington disease can be developed, it could become justifiable to test everyone.
The discovery of the HTT repeat expansion inspired other groups to search for this type of variant in other conditions. There are now at least 56 different genes where STR have been associated with human disease (Figure 2), including fragile X syndrome (FMR1 gene), which is one of the most common forms of inherited intellectual disability and a top-tier condition recommended for carrier screening by the American College of Medical Genetics and Genomics.
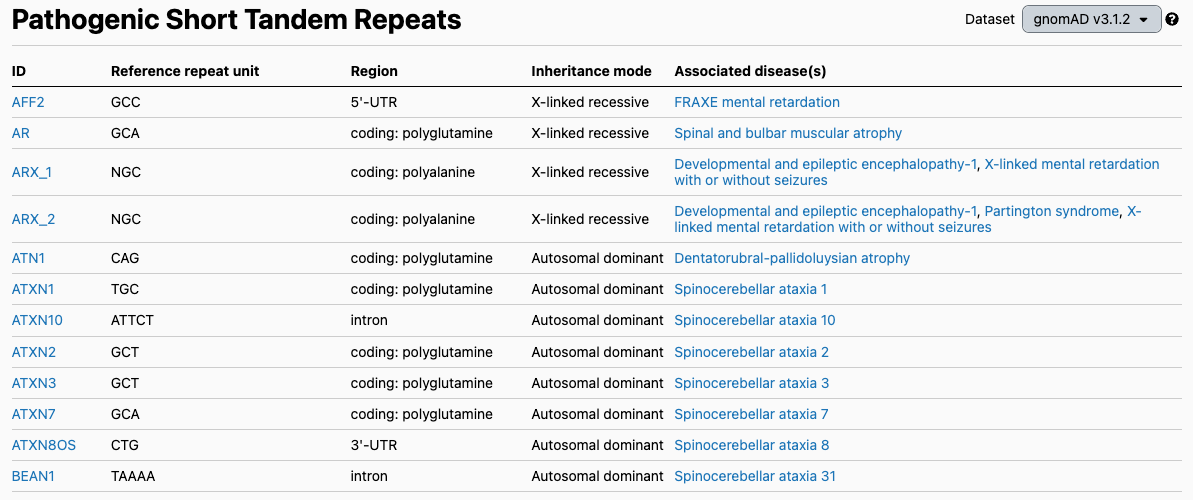
Figure excerpted from the gnomAD v3 database, PMID 32461654.1
How are STR typically analyzed?
The first effective methodology for evaluating STR was the Southern blot. While this method is highly sensitive, it is cumbersome to perform in the lab and it is difficult to assess the exact number of repeats (Figure 3).
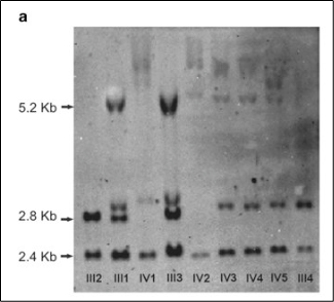
Truncated figure excerpted from PMID 21107340.2 Original caption: "Southern blot analysis of FMR1 (fragile X mental retardation 1) gene. Sizes of normal unmethylated (2.8 kb), normal methylated (5.2 kb) and a control band (2.4 kb) are indicated."
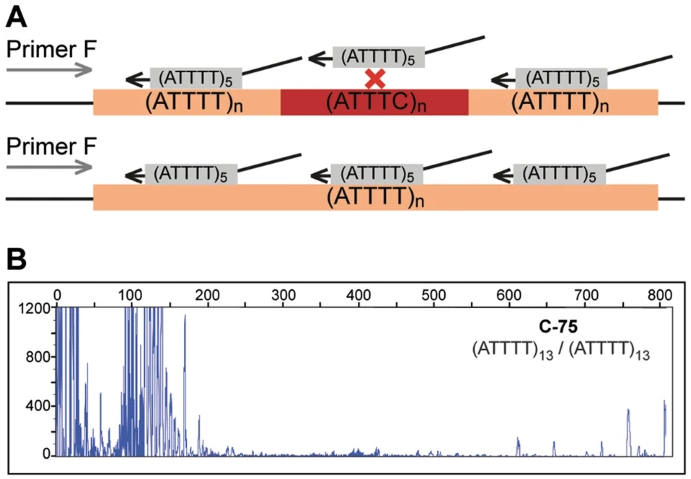
Truncated figure excerpted from PMID 29891931.3 Original caption: "ATTTT RP-PCR to detect large pentanucleotide alleles in DAB1. a Schematic representation of the ATTTT RP-PCR primers that anneal with the repetitive ATTTT region, resulting in DNA amplification in normal and mutant alleles. b Electropherograms showing the fluorescent ATTTT RP-PCR analysis in control individuals from Table 1: C-75, C-88, C-91, C-95, and C-44; and in SCA37 affected individuals A-1 and A-9"
Can STR be analyzed using panel or exome data?
Unfortunately, for certain repetitive patterns, the library preparation and target amplification or hybridization processes necessary for panel and exome sequencing by NGS can remove the repetitive DNA from the assay. No amount of bioinformatics can rescue a signal that isn’t in the tube. That said, recent studies indicate that enrichment-based NGS may be viable for certain loci and can improve the diagnostic yield of exome-based testing. The effect of probe capture and PCR amplification is not the same across all STR patterns. While that behavior hasn’t been fully characterized across all known STR loci, it is generally understood that 100% GC motifs are particularly difficult to amplify.
Where does DRAGEN STR come in?
In contrast to panel or exome sequencing, PCR-free whole-genome sequencing (pfWGS) retains the repetitive genomic DNA for sequencing. The challenge for researchers then becomes genotyping the repeat lengths when the most relevant expanded alleles often exceed the read length of short-read Illumina sequencing data. To address this issue, Illumina alumni Egor Dolzhenko, PhD, Michael Eberle, PhD, and colleagues developed ExpansionHunter. First they created a custom set of references for important STR regions against which subject data can be compared. The algorithm identifies informative sequence reads for pfWGS data, such as reads in flanking regions and reads containing the repeat sequence along with their paired-end mates. Combining the specially prepared references with these reads, the algorithm can readily identify non-expanded alleles and flag cases with potentially expanded ones.
Illumina’s DRAGEN secondary analysis includes STR genotyping using ExpansionHunter as an option for any samples with pfWGS data. This can be run on local hardware or in the cloud. If you are curious about implementing DRAGEN workflows with your data, please reach out!
For those interested in the math and bioinformatics, the primary literature is a great resource. A previous publication goes into even more detail.
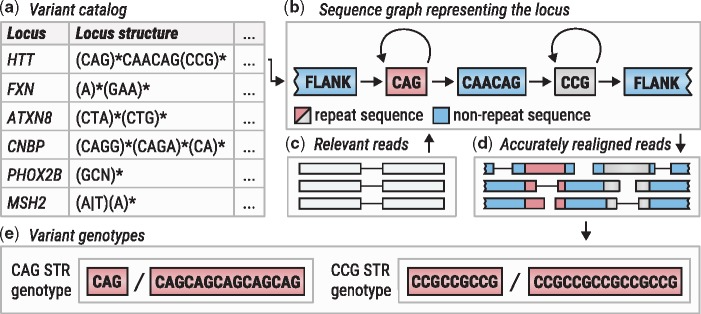
Figure excerpted from PMID 31134279.4 Original caption: "Overview of ExpansionHunter. (a) A locus definition is read from the variant catalog file. (b) Sequence graph is constructed according to its specification in the variant catalog. (c) Relevant reads are extracted from the input binary alignment/map file. (d) Reads are aligned to the graph. (e) Alignments are pieced together to genotype each variant"
How does DRAGEN STR perform?
When challenged with a series of positive and negative data sets for multiple STR expansion conditions, ExpansionHunter exhibited excellent performance (Figure 6). All the positive controls tested positive except one, demonstrating extremely high accuracy. The negative predictive value (percentage of true negatives testing negative) was also extremely high, though normal controls tested positive. These findings combined strongly support a “screen and confirm” approach, where pfWGS is performed on all participants and follow-up rpPCR can be used to confirm potential expansions in genes where participants are above a laboratory validated cutoff value.
The lone false negative in the study from Figure 6 is worth further discussion. This sample has an FMR1 pre-mutation, but was considered normal using the predefined cutoff. This suggests that a clinical laboratory may want to consider using a slightly lower cutoff and accepting a modestly higher rpPCR confirmation rate to ensure full sensitivity for this expansion type. This is a classic example of the give-and-take nature of balancing sensitivity against specificity.
As part of the development of an in vitro diagnostic device for whole-genome sequencing, 157 expanded alleles across 11 loci with clinical association and ~700 known negative alleles per STR locus were evaluated in a similar fashion. In this study, the sensitivity was 98% with a < 1% per sample false positive rate. The sensitivity was improved to 100% when using a more permissive cutoff for ATXN1 and ATXN2.
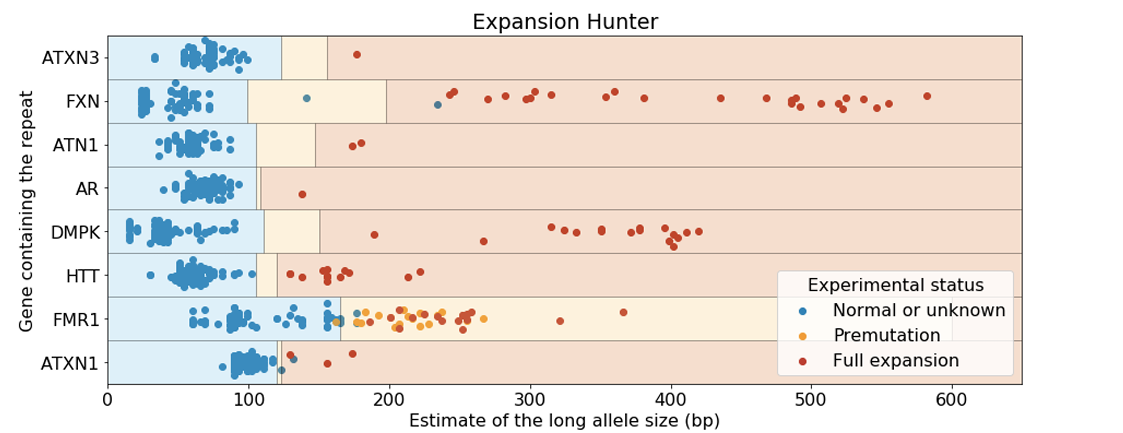
Truncated figure excerpted from PMID 31134279.4 Original caption: "Analysis of Coriell samples harboring known repeat expansions. The blue, orange, and red rectangles define the expected size ranges for normal, premutation, and full expansion respectively for the corresponding repeat. Each dot corresponds to the size of the longest allele and its color is set according to the experimentally-determined status. GangSTR was run onlyon STRs for which predefined off-target loci were provided. GangSTR values were calculated using their 'genome-wide' mode for all of the genes except FMR1 which was analyzed using 'targeted' mode which performed much better for this repeat. The repeat sizes were capped at 600bp."
This work was replicated by the UK-based 100,000 Genomes Project team, who evaluated STR in that population-scale dataset (PMID: 35182509).5 In this study, potential STR expansions from 404 individuals with neurological phenotypes consistent with having an expansion disorder were identified by WGS and Expansion Hunter (Figure 7). Potential positives were confirmed via PCR. Their findings were impressive:
“Whole genome sequencing correctly classified 215 of 221 expanded alleles and 1316 of 1321 non-expanded alleles, showing 97·3% sensitivity (95% CI 94·2-99·0) and 99·6% specificity (99·1-99·9) across the 13 disease-associated loci when compared with PCR test results.”
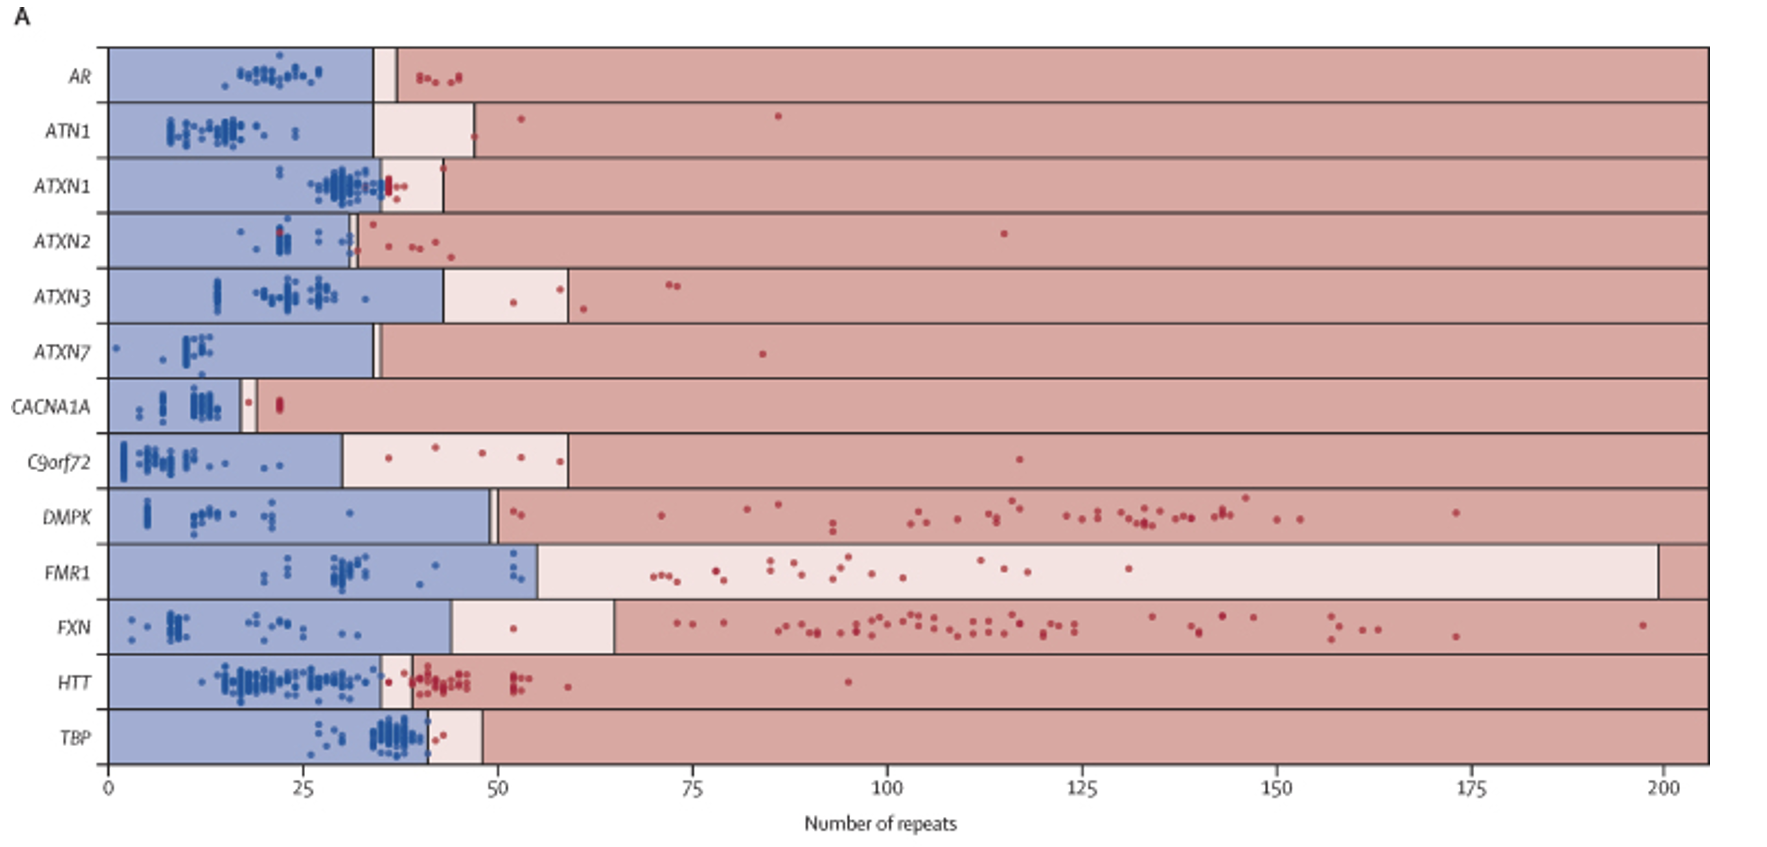
Truncated figure excerpted from PMID 35182509.5 Original caption: “Performance of repeat expansion detection using whole genome sequencing—Swim lane plot showing sizes of repeat expansions predicted by ExpansionHunter across 793 expansion calls. Each genome is represented by two points, one corresponding to each allele for each locus, with the exception of those on the X chromosome (ie, FMR1 and AR) in males, for which only one point is shown. Points indicate the repeat length estimated by ExpansionHunter after visual inspection and the colours indicate the repeat size as assessed by PCR (blue represents non-expanded; red represents expanded). The regions are shaded to indicate non-expanded (blue), premutation (pink), and expanded (red) ranges for each gene, as indicated in the appendix (p 28). Blue points in pink or red shaded regions indicate false positives and red points in blue shaded regions indicate false negatives. The individual calls are provided in the appendix (p 27).”
Is it possible to discover new STR loci?
To greatly improve the range of diseases covered and to support researchers seeking to solve undiagnosed diseases, the ExpansionHunter team devised a new approach to identify putative STR expansions by scouring the genome to find pileups of repetitive reads and then comparing the coverage and position of these pileups between affected individuals and a cohort of control samples. Using this new tool, called ExpansionHunter Denovo, classic STR conditions like Friedreich ataxia and fragile X were “rediscovered” (Figure 8). Overall, 41 out of 44 known expansions were confirmed as positive using this approach. A re-engineered version of this package is planned for an upcoming DRAGEN release; please get in touch if you are interested in learning more.
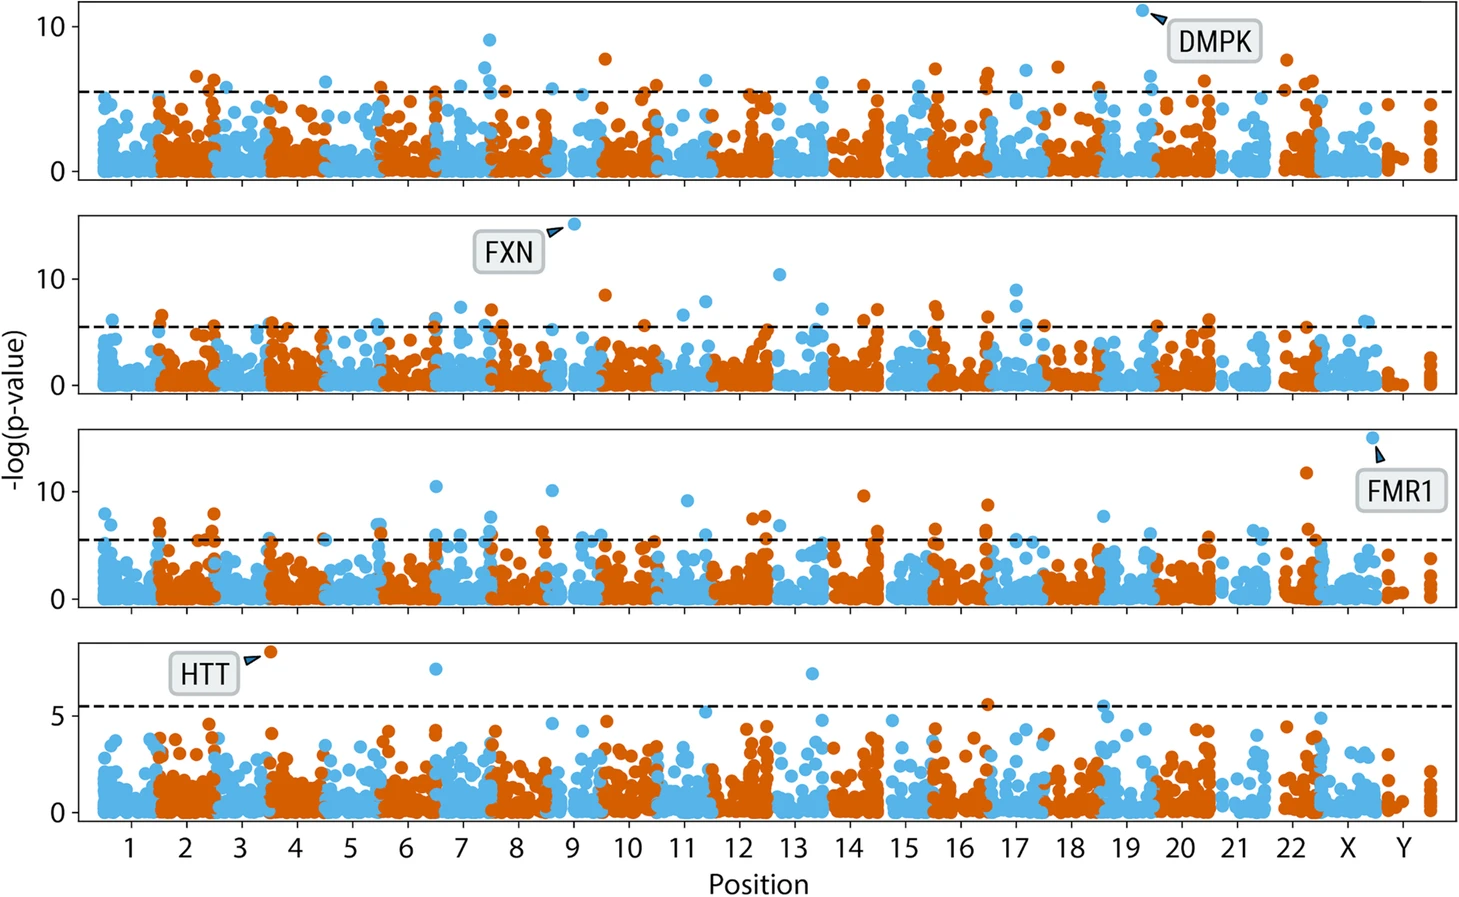
Figure excerpted from PMID 32345345.5 Original caption: "Genome-wide analysis of anchored IRRs comparing cases with known pathogenic expansions in DMPK, FXN, FMR1, and HTT genes (top to bottom) to 150 controls"
How can STR detection be implemented?
The two major ways you can run ExpansionHunter are as part of a DRAGEN workflow or independently as stand-alone software. Versions of the DRAGEN DNAseq pipeline 3.7.5 or later include the option to perform ExpansionHunter analysis (see online help for details). DRAGEN can be run using physical hardware (“on-prem”) or as part of cloud-based workflows on multiple platforms. The software is also available as a stand-alone package on GitHub (Table 2).
| Platform | Type | Description | Link | ||||||
| DRAGEN secondary analysis | On-prem server* | Custom designed computer hardware optimized for accuracy and speed of secondary genomic analysis (alignment and variant calling). | https://www.illumina.com/products/by-type/informatics-products/dragen-bio-it-platform.html | ||||||
| Emedgene | Cloud | A cloud-based platform for genomic analysis, including panels, exomes, and whole genomes. This includes DRAGEN secondary analysis, annotation, filtering and tertiary analysis workflows, a knowledge database, robust reporting tools, and artificial-intelligence-based variant prioritization. | |||||||
| BaseSpace Sequencing Hub | Cloud | A cloud-based bioinformatics platform designed for managing Illumina sequencing runs and analyses. | |||||||
| Illumina Connected Analytics | Cloud | A cloud-based bioinformatics platform designed for data management and analysis across projects and types. | https://www.illumina.com/products/by-type/informatics-products/connected-analytics.html |
||||||
| TruSight Software Suite | Cloud | A cloud-based platform for end-to-end genomic analysis of exomes and whole genomes. | https://www.illumina.com/products/by-type/informatics-products/trusight-software-suite.html | ||||||
| Linux | Software | The original ExpansionHunter software package is available for research use and can be executed on your own server. |
*“On-prem” refers to physical “on premises” computer hardware that is installed in a server room/cabinet.
Table 2.
For more information or a DRAGEN trial license for academic use, please contact dragen-info@illumina.com.
June 4, 2024: This article has been updated with a new section on key takeaways; new information in the sections "Can STR be analyzed using panel or exome data?", "How does DRAGEN STR perform?", and "Is it possible to discover new STR loci?"; and a new figure 7.
References
- Karczewski KJ, Francioli LC, Tiao G, et al. The mutational constraint spectrum quantified from variation in 141,456 humans. Nature. 2020;581:434-443. doi:10.1038/s41586-020-2308-7
- Martorell L, Nascimento M, Colome R, Genovés J, Naudó M, Nascimento A. Four sisters compound heterozygotes for the pre- and full mutation in fragile X syndrome and a complete inactivation of X-functional chromosome: implications for genetic counseling. J Hum Genet. 2011;56:87-90. doi:10.1038/jhg.2010.140
- Loureiro JR, Oliveira CL, Sequeiros J, Silveira I. A repeat-primed PCR assay for pentanucleotide repeat alleles in spinocerebellar ataxia type 37. J Hum Genet. 2018;63:981-987. doi:10.1038/s10038-018-0474-3
- Dolzhenko E, Deshpande V, Schlesinger F, et al. ExpansionHunter: a sequence-graph-based tool to analyze variation in short tandem repeat regions. Bioinformatics. 2019;35(22):4754-4756. doi:10.1093/bioinformatics/btz431
- Ibañez K, Polke J, Hagelstrom RT, et al. Whole genome sequencing for the diagnosis of neurological repeat expansion disorders in the UK: a retrospective diagnostic accuracy and prospective clinical validation study. Lancet Neurol. 2022;21(3):234-235. doi:10.1016/S1474-4422(21)00462-2
- Dolzhenko E, Bennett MF, Richmond PA, et al. ExpansionHunter Denovo: a computational method for locating known and novel repeat expansions in short-read sequencing data. Genome Biol. 2020;21:102. doi:10.1186/s13059-020-02017-z