Spatial transcriptomics data set

Explore gene expression patterns in spatial context with Illumina StrataMap Spatial solution

Spatial transcriptomics demo data set

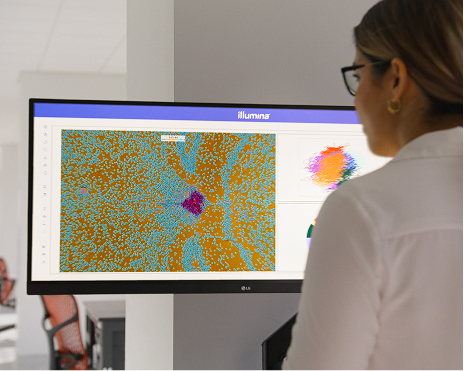
This demo data set demonstrates how StrataMap Spatial Transcriptome reveals where gene expression happens within intact tissue, connecting molecular data to cellular context at scale.

Using a mouse kidney section processed with StrataMap Spatial Transcriptome, sequenced on the NovaSeq X Plus Sequencing System, and analyzed with DRAGEN secondary analysis and Illumina Connected Multiomics, these data show the performance of the complete Illumina spatial solution.

For researchers designing spatial experiments, the data offer a concrete reference point for evaluating cell segmentation accuracy, gene detection depth, and read mapping quality prior to a run.

Spatial transcriptomics data overview

Experiment details

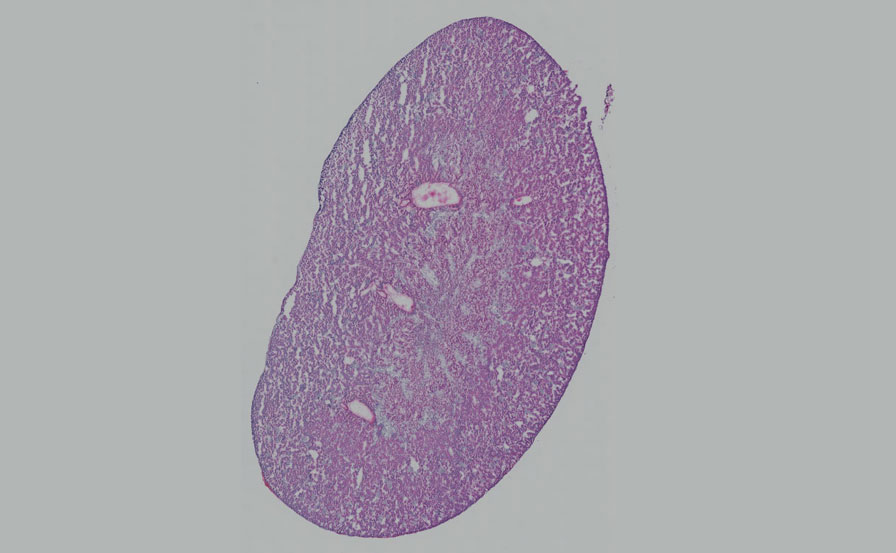
Normal, fresh frozen mouse kidney
C57BL/6 mouse strain
8-week-old male


10 µm section
H&E stained
Imaged at 20× with Keyence BZX-810 fluorescence microscope
Samples processed on Illumina spatial substrate

Sequenced with NovaSeq X Plus System
100-cycle, 25B flow cell
1 × 130 + 8 bp read length

Data was processed through Illumina Connected Analytics, using DRAGEN Spatial Transcriptome v1.1.6. Data processed in Illumina Connected Multiomics for tertiary analysis.

/ Results

Key metrics &
performance highlights

  • Number of identified cells
    276,925
  • Mean sequencing barcodes per cell
    18,977
  • Median unique transcripts per cell
    4152
  • Total genes detected
    38,115
  • Median genes per cell
    1795
Key metrics &
performance highlights


Explore the full data set

Go beyond the topline metrics. Request a demo of Illumina Connected Multiomics to explore this mouse kidney data set alongside spatial, single-cell, proteomics, and more.


Cell segmentation specifications

 
  • Number of cells
    276,925
  • Unique transcripts in cells (%)
    74%
  • Mean sequencing barcodes per cell
    18,977
 

Spatial read mapping metrics

 
  • Total genes detected
    38,115
  • Reads mapped to spatial barcodes
    5,255,153,008
  • Sequencing saturation
    66%

See the full data set

Go deeper than topline metrics. Explore more spatial transcriptomics performance data, including:

  • Cell segmentation specifications
  • Spatial gene expression and tissue alignment data
  • Data visualizations and sequencing depth evaluation

Speak to a specialist

Have questions about the data or ready to plan your own spatial transcriptomics experiment? Our specialists can help you evaluate workflow fit and get started.